Exceptionality.

Jeremy. Lee

(C) 1998

Normality. Exceptionality. These are puzzling concepts in that you simply cannot point a finger at a person and honestly say, "Look. There is a normal person." Many people acknowledge this and, perhaps, somewhat in error state that there is no such thing as normal anyway.

Perhaps that is partly correct. There is no such thing as normal, usually. To consider a simple object like a biscuit as a normal biscuit as opposed to a burnt one is perfectly feasible and intuitive. To categorise and measure complex systems with the same ease is of course impossible. Yet this is exactly what many apparently highly educated, responsible people in positions of community power purport to be able to do. It is absurd.

The term "Normal" refers to being close to the mean. So what? What does mean mean? (pun intended). Mean is the mathematical term for average, and average is a concept not a concrete object which you can hold in your hand. An average value has the advantage of being able to be combined with meaning and correctness within statistical systems with other averages within the system or with a compatible system. That's it. That's all you can really use an average for! It tells you nothing about the characterisitics of the original data, it's variability, spread, reliability and so on.

Therefore, statistal analysis often requires the recognition that the data fits a certain type of distribution, of which there are many but the most common and useful

is the NORMAL distribution. A huge number of complex systems that are driven by random processes may be characterised in this way. We may include telephone systems, the height of trees, shoe sizes, people's weight and of course
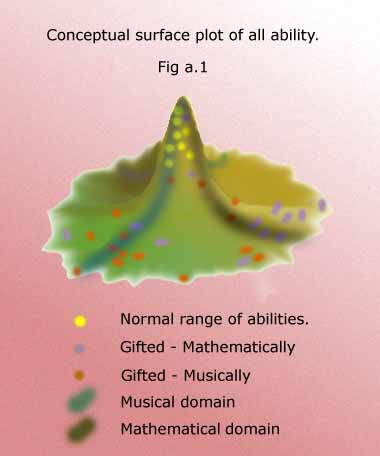
 intelligence.

Intelligence is one of those really hard to measure things.... nowhere near as simple as "shoe size" and the whole concept of intelligence is complex to an extraordinary degree, but we are still able to put some kind of number on a person's intelligence. A number that can and does have a certain meaning, like "The most reliable objective measure that we possess as a predictor for achievement in school." but which sadly has been taken out of context and with ignorance for many years.


Dr. Michiu Kaku - Professor of Theoretical Physics has written a book called Hyperspace and, although this has two tenths of a gnat's toe to do with gifted children, I mention the book because of the very enlightening way how Kaku explains that many problems can be greatly simplified by adding more dimensions.

You would think at first that adding dimensions would complicate matters, but consider the hedge maze at Hampton Court... if you walk the maze it is difficult since you are restricted to two dimensions. However by adding a third dimension and viewing the maze from above, you can solve it easily. Similarly, knots that are impossible to untie in 3D fall apart in 4D.

Kaku's book, together with a dissatisfaction with the contemporary use and presentation of IQ scores leads me to present a proposition:

"At least in concept... we should consider a model of three dimensions when attempting to explain the meaning of intelligence in human beings."

Such a model is presented below for consideration.

Examples of 2D plots of the normal distribution.


Perhaps this may be called a normal-surface-distribution.

Note how there are many yellow spots clustered near the peak. This is representative of most of the population. We can also imagine various domains including but not limited to Mathematical and Musical. I've deliberately made these domains fuzzy since there should be no reason to suggest that there is a hard and fast delineation between, say Spatial ability and Mathematical ability, or Mathematical ability and verbal ability.

To explain what I mean by this, have a look first at this simulation http://www.math.chalmers.se/~stefanf/normal.html of the normal distribution produced by dropping little balls through a lattice of pegs in the plane of the paper, then see if you can imagine what it would look like if there were a cube of pegs instead... the balls would not only fall left and right, they could go back and forth as well. Obviously, this would result in a three dimensional bell shape - a little like a real bell, and the base would be circular (tending to infinity in theory). This is the same result that you would get if you aimed at a target with a shot gun and fired at the centre and plotted the density of lead shot around the bull's eye.


Can you imagine cutting any cross section through a line of symmetry in the above plot... what do we get ? the normal curve in a single plane, but we can do this an infinite number of times because there are infinite symmetries.

I find this appealing because, each cross section could represent a particular kind of ability if you apply it to giftedness in people. We can then see very clearly why those who are highly gifted and beyond find it very difficult to find like-minds, since you not only have to find someone near the same radius, you also have to be close in position on the circumference at that radius. This difficulty is compounded by the fact, clearly shown by the plot above, that high ability is rare, and very high ability is still more rare.


To make it more realistic, just as there is a spread of abilities and talents in a particular IQ test for the same person, there would be a fragmented surface if it were possible to plot and view a large range of abilities and talents, imagine a plan view of the surface plot. You would see, perhaps a spot near the middle representing fine-motor skills, and a spot at 10cm diameter representing logical reasoning, and one at 5cm for verbal comprehension and so on. We could call this the "footprint" of the bell surface. Since the population becomes more and more scarce as the radius increases so the likelihood of finding even two people with a close matching footprint is dramatically less likely still, even though they may score similar values on an IQ test of some kind.


It should be stressed that this hypothesis has not been researched and backed up by practical methods and there is no solid mathematical reason to suggest that "all abilities" fit the normal distribution. Perhaps something like "creativity" for example does not fit the bell curve and this may well be why we have no objective creativity tests. I find it likely that some abilities are highly skewed or fit a different distribution altogether in which case - providing that it were possible to measure it, our surface plot would be somewhat irregular but the overall benefit of working in three dimensions remains.

Is it practical to actually try and plot this hypothetical surface? Not really, it's hard to plot anything with infinite data input, but perhaps if we used a good number of subtests as used in the WISC-III and other IQ tests, but supplemented by perhaps as yet undeveloped objective tests for other kinds of intelligences as proposed by Howard Gardner then we could come close.

Despite the above limitations, I do feel that the concept at least is a useful tool for explaining why gifted children :