Take me
back
HOME
The Binomial and Poisson distribution are models for what might happen in the future for discrete random variables. The Normal Distribution is one model for continuous random variables that often occurs in practice. Note that not all continuous variables will have a normal distribution - there are hundreds of different distributions.
The normal distribution is the most important continuous probability distribution in statistics and is well known to be a good fit in relation to IQ scores. However, it has been noted more than once that there seem to be many more children who score exceptionally high ( say > 160 IQ ) than is predicted by the theoretical curve. So you could expect in practice to find a little raised bump at the top end of an experimentally gathered set of IQ scores. At the time of writing, I have not seen an explaination for this.
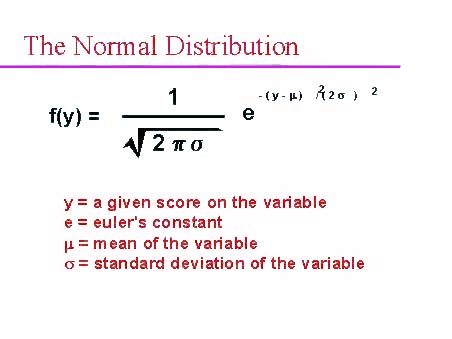
Normal distributions are a family of distributions that have the same general shape. They are symmetric with scores more concentrated in the middle than in the tails. Normal distributions are sometimes described as bell shaped. Examples of normal distributions are shown below. Notice that they differ in how spread out they are. The area under each curve is the same. The height of a normal distribution can be specified mathematically in terms of two parameters: the mean (m) and the standard deviation (s).
For example, it was noted long ago (18th and 19th centuries) that the graph of the distribution of many biological characteristics could be described by a particular shape -- the bell-shaped curve. The mean is the average which corresponds to an IQ score of 100% and lies exactly in the middle of these symmetrical curves.
The broad, flat curves have a high standard deviation. The tall narrow ones have a small standard deviation. It seems intuitive that different types of IQ tests will have different standard deviations and therefore some tests will tend to constrain the subjects about the mean while others will allow greater discrimination further from the mean. Ergo, your so called "IQ score" is dependent on the type of test taken.
In any normal distribution there is a relationship between the proportion of cases in between + or - each standard deviation from the mean. Here is that relationship in tabular form:
|
Spread |
Proportion of Cases |
|
+ or -1 standard deviation |
68.26% |
|
+ or -2 standard deviations |
95.44% |
|
+ or -3 standard deviations |
99.74% |
A child who is described as being in the 99th percentile is thus somewhere beyond about 2.5 standard deviations from the mean. A child above the 99.9th percentile is somewhere beyond three standard deviations above the mean.
The numerical difference between 99 and 99.9 is relatively small, BUT the difference in ability and behavioural characteristics of two chiildren on opposite borders of this range is very great.
While this link remains active - you might be interested to watch a simulation of a normal distribution by watching little balls fall through pegs. http://www.math.chalmers.se/~stefanf/normal.html